|
|
|
|
|
|
|
|
|
|
 |
 |


 |
|
|
|
|
|
|
|
|
|
|
|
|
|
|
|
|
 |
|
|
|
|
|
|
|
|
|
|
|
|
|
|
|
 |
|
|
|
 |
 |
 |
 |
 |
 |
 |
 |
 |
 |
|
|
|
 |
33 |
10 |
23 |
6 |
3 |
0 |
0 |
14 |
26% |
61% |
|
|
|
of which: |
|
|
|
Afternoon matches |
10 |
3 |
7 |
2 |
0 |
0 |
0 |
5 |
29% |
71% |
|
|
|
T20 matches |
19 |
3 |
16 |
2 |
4 |
3 |
0 |
9 |
25% |
56% |
|
|
|
including: |
|
|
|
Ken Block Trophy |
3 |
0 |
3 |
0 |
0 |
2 |
0 |
1 |
0% |
33% |
|
|
|
|
|
|
|
|
|
|
|
|
|
|
|
|
|
 |
|
|
 |
 |
 |
 |
|
 |
 |
 |
|
|
|
 |
|
|
|
|
2,664 |
163 |
565.3 |
3,393 |
|
16.34 |
4.64 |
20.82 |
|
|
|
Afternoon matches |
1,050 |
57 |
246.4 |
1,480 |
|
18.42 |
4.16 |
25.96 |
|
|
|
T20 matches |
1,614 |
106 |
318.5 |
1,913 |
|
15.23 |
5.03 |
18.05 |
|
|
|
 |
|
|
|
|
3,011 |
128 |
548.1 |
3,289 |
|
23.52 |
5.49 |
25.70 |
|
|
|
Afternoon matches |
1,233 |
47 |
255.0 |
1,530 |
|
26.23 |
4.84 |
32.55 |
|
|
|
T20 matches |
1,778 |
81 |
293.1 |
1,759 |
|
21.95 |
6.06 |
21.72 |
|
|
|
|
|
|
|
|
|
|
|
|
|
|
|
 |
|
|
Highest Team Scores |
|
Highest Team Scores Against |
|
|
1st |
198 all out (v SMCC Midweek XI, Wed 8 Sept) |
|
1st |
243-9 (by SMCC Midweek XI, Wed 8 Sept) |
|
|
2nd |
170-8 (v St Anne's Allstars, Sun 25 Apr) |
|
2nd |
202-4 (by Bank of England, Wed 2 June) |
|
|
3rd |
168 all out (v Mandarins, Sun 18 Apr) |
|
3rd |
191-6 (by Mandarins, Sun 18 Apr) |
|
|
|
Lowest Team Scores (completed innings) |
|
Lowest Team Scores Against (completed innings) |
|
|
1st |
71-7 (v Kings Road, Thu 1 July) |
|
1st |
78-7 (by Hendricks XI, Thu 22 July) |
|
|
2nd |
76 all out (v Allstars, Thu 17 June) |
|
2nd |
85-5 (by Tideway, Thu 5 Aug) |
|
|
3rd |
77-7 (v Marauders, Tue 10 Aug) |
|
3rd |
97-4 (by LT Dinos, Thu 19 Aug) |
|
|
|
Largest margins of victory |
|
Largest margins of loss |
|
|
Batting 1st |
by 49 runs (v Tideway, Thu 5 Aug) |
|
Batting 1st |
by 7 wickets (for Ad Hoc, Thu 10 June) |
|
|
Batting 2nd |
by 5 wickets (v LSE Staff, Wed 23 June) |
|
Batting 2nd |
by 99 runs (for Marauders, Tue 10 Aug) |
|
|
|
|
|
|
|
|
|
|
 |
|
|
|
|
|
|
|
|
|
|
|
|
 |
|
|
 |
|
 |
|
 |
|
|
1st |
Barry Gigg (22) |
|
1st |
Barry Gigg (372) |
|
1st |
Gary Plahe (19) |
|
|
2nd |
Gary Plahe (18) |
|
2nd |
George Warren (330) |
|
2nd |
Konrad Chodzko-Zajko (18) |
|
|
3rd= |
George Warren (16) |
|
3rd |
Matthew Conway (227) |
|
3rd |
Michael Duggan (14) |
|
|
3rd= |
Konrad Chodzko-Zajko (16) |
|
|
|
 |
|
 |
|
|
1st |
Barry Gigg (6) |
|
1st |
George Warren (8) |
|
|
2nd= |
George Warren (3) |
|
2nd |
Barry Gigg (4) |
|
|
2nd= |
Matt Sears (3) |
|
3rd |
Chris Thomson (1) |
|
|
|
|
|
|
|
|
|
|
 |
|
|
  |
|
|
|
Matt Sears |
67 v St Anne's Allstars (Sun 25 Apr) |
|
|
George Warren |
67 v Mandarins (Sun 18 Apr) |
|
|
George Warren |
58no v Bank of England (Wed 2 June) |
|
|
NJ |
53 v SMCC Midweek XI (Wed 8 Sep) |
|
|
Paul Gaught(-Allen) |
50no v LSE Staff (Wed 23 Jun) |
|
|
|
Unfortunately there were no 5 wickets in an innings, hat tricks, centuries, 3 catches in a match or 3 stumpings in a match. |
|
|
|
59 players represented Superstars in 2021, of which 11 had the proud moment of making their debut for the club. Those debutants were- |
|
|
|
Arandeep, Chris Bates, Chris Browne, David Williams, Ed Furst, "Mark", Matt Brown, Mikal Usman, Paul Blanchard, Sam Farnham, Sohail. |
|
|
|
|
|
|
|
|
|
|
|
|
|
|
 |
|
|
|
|
|
|
|
|
|
|
|
|
|
|
 |
|
|
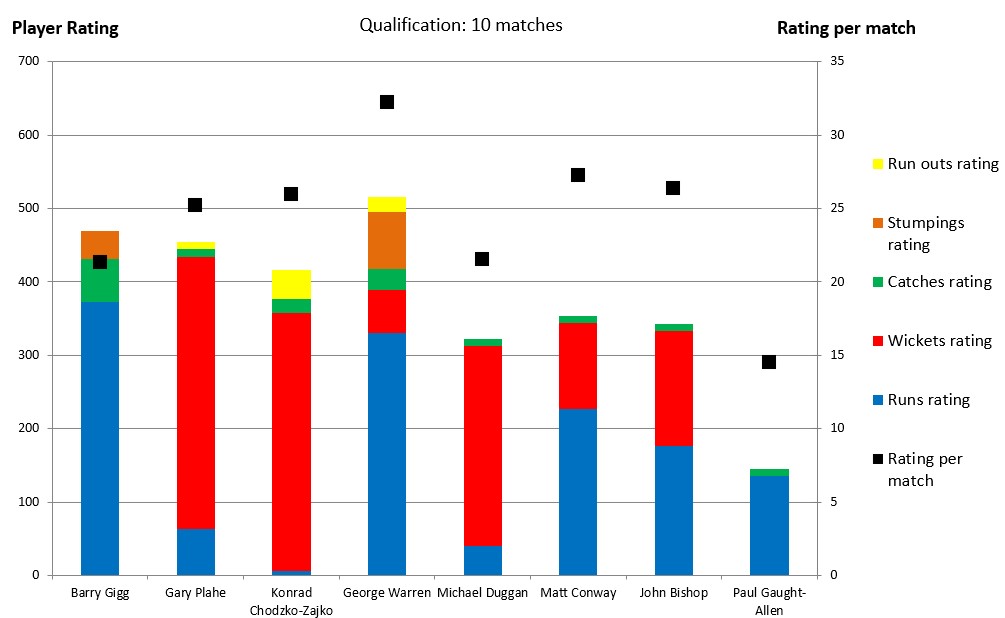
Qualification for averages: 125 runs and 5 innings |
|
|
|
 |
 |
 |
 |
 |
 |
|
 |
 |
 |
|
|
1 |
Barry Gigg |
22 |
23 |
10 |
372 |
28.62 |
- |
- |
44no |
|
|
2 |
George Warren |
16 |
18 |
2 |
330 |
20.63 |
2 |
- |
67 |
|
|
3 |
John Bishop |
13 |
14 |
5 |
177 |
19.67 |
- |
- |
46 |
|
|
4 |
Matthew Conway |
13 |
14 |
1 |
227 |
17.46 |
- |
- |
47 |
|
|
5 |
Paul Gaught(-Allen) |
10 |
11 |
1 |
135 |
13.50 |
1 |
- |
50no |
|
|
|
Notes: |
|
Batting Average = Total Runs scored/Times dismissed |
|
|
Complete batting averages,
including non-qualifiers available here. |
|
|
|
|
|
|
|
|
|
|
|
|
|
|
|
|
|
|
|
|
|
|
 |
|
|
|
|
|
|
|
|
|
|
|
|
|
|
|
|
|
|
Qualification for averages: 8 wickets |
|
|
|
|
|
 |
|
 |
 |
|
|
|
 |
 |
|
|
1 |
John Bishop |
15 |
0 |
63 |
8 |
7.88 |
4.20 |
11.25 |
- |
3-4 |
|
|
2 |
Alok Singh |
35 |
7 |
101 |
11 |
9.18 |
2.89 |
19.09 |
- |
3-10 |
|
|
3 |
Dan Forman |
18.3 |
0 |
103 |
9 |
11.44 |
5.57 |
12.33 |
- |
3-14 |
|
|
4 |
Konrad Chodzko-Zajko |
68.2 |
8 |
314 |
18 |
17.44 |
4.60 |
22.78 |
- |
3-16 |
|
|
5 |
Gary Plahe |
69.4 |
6 |
338 |
19 |
17.79 |
4.85 |
22.00 |
- |
4-11 |
|
|
6 |
Michael Duggan |
59 |
0 |
424 |
14 |
30.29 |
7.19 |
25.29 |
- |
2-16 |
|
|
|
Notes: |
|
Bowling Average = Total Runs conceded/Total wickets |
|
Economy Rate = Total Runs conceded/Total overs (remembering there are 6 balls in an over, not 10) |
|
Strike Rate = Total balls balled/Total wickets |
|
|
Complete bowling averages,
including non-qualifiers available here. |
|
|
|
|
|
|
|
|
|
|
|
|
|
|
|
|
|
 |
|
|
|
|
|
|
|
|
|
|
|
 |
|
|
|
|
 |
 |
 |
 |
 |
|
|
|
1 |
George Warren |
16 |
3 |
8 |
1 |
12 |
|
|
2 |
Barry Gigg |
22 |
6 |
4 |
0 |
10 |
|
|
3 |
Konrad Chodzko-Zajko |
16 |
2 |
0 |
2 |
4 |
|
|
4= |
Matt Sears |
6 |
3 |
0 |
0 |
3 |
|
|
4= |
Chris Thomson |
7 |
2 |
1 |
0 |
3 |
|
|
4= |
Jack Lovell |
3 |
1 |
0 |
2 |
3 |
|
|
| Complete fielding stats available here. |
|
|
|
|
|
|
|
|
|
 |
|
|
|
|
|
|
|
|
|
 |
|
|
|
|
|
 |
 |
|
|
|
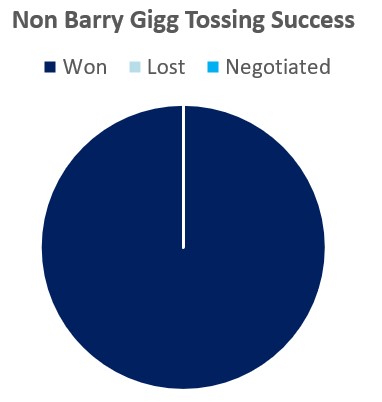
Barry Gigg |
9 |
12 |
1 |
22 |
|
|
Matthew Conway |
1 |
- |
- |
1 |
|
|
Paul Gaught(-Allen) |
1 |
- |
- |
1 |
|
|
John Bishop |
1 |
- |
- |
1 |
|
|
Total |
12 |
12 |
1 |
25 |
|
|
|
  |
|
|
|
|
|
|
|
|
|
|
|
|
|
|
|
|
|
|
 |
|
|
The complete Excel workbook for the season is downloadable. |
|
|
|
 |
|
|
|
|
|