|
|
|
|
|
|
|
|
|
|
 |
 |


 |
|
|
|
|
|
|
|
|
|
|
|
|
|
|
 |
|
|
 |
The club have won 54% of the games in its history and lost 42%. The remaining games have been tied, drawn and abandoned. |
|
|
|
|
The 1994 win percentage of 93.3% (14 wins in 15 games) was the highest in the club's history. In three years (1995, 2003 and 2005) the club have won a record 19 matches. |
|
|
|
|
The 2023 win percentage of 12.5% (2 wins in 16 games) was the lowest in the club's history. In two years (2017, 2019) the club lost a record 20 matches. |
|
|
|
|
There have been 15 abandoned matches, the last being v Westminster in 2024. There have been 10 tied matches, the last being v Dodgers in 2021. There have been 4 drawn matches, the last being v Bank of England in 2017. |
|
|
|
|
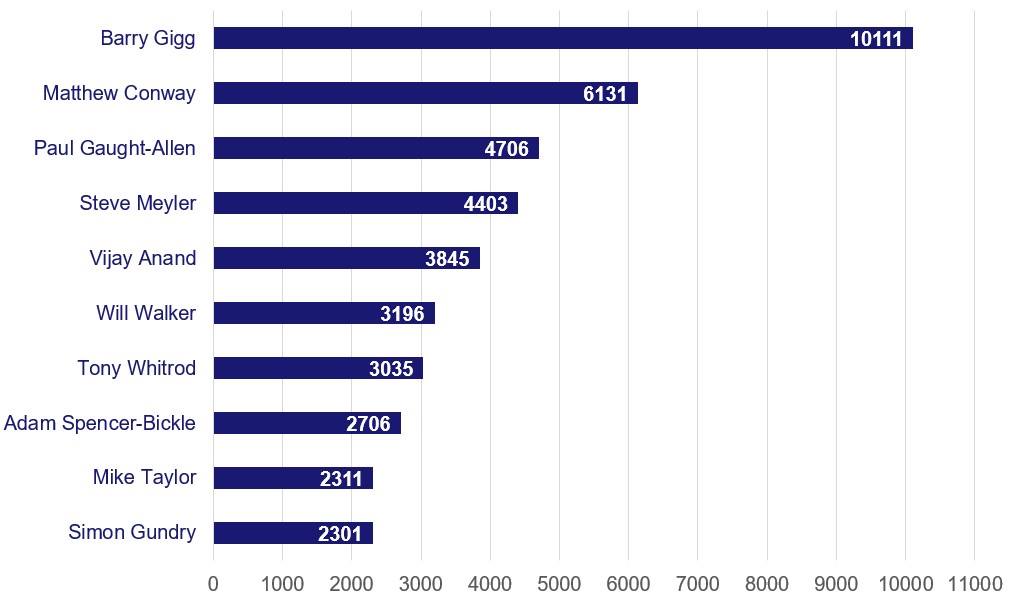
Barry Gigg is the dominant run scorer in the club's history. His 10,249 runs great exceeds any other batter with Matthew Conway the nearest at a "mere" 6,335. Gigg is also only one of two Superstars to score multiple centuries (the other being Will Walker). |
|
|
|
|
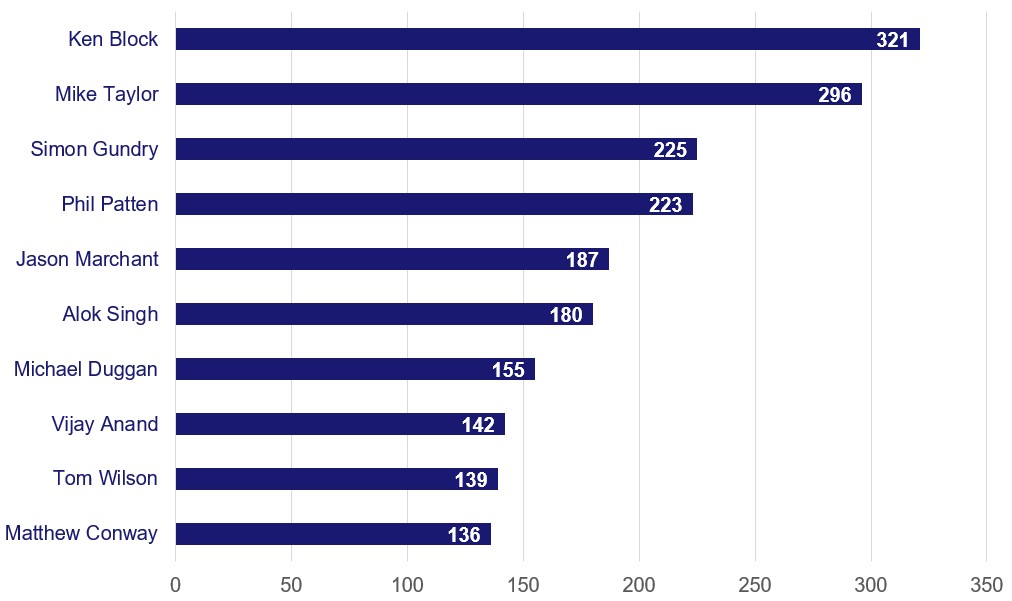
Whilst there is no clear dominant bowler in the club's history, Ken Block has taken the most wickets (321) with Mike Taylor (302) relatively close behind. |
|
|
|
|
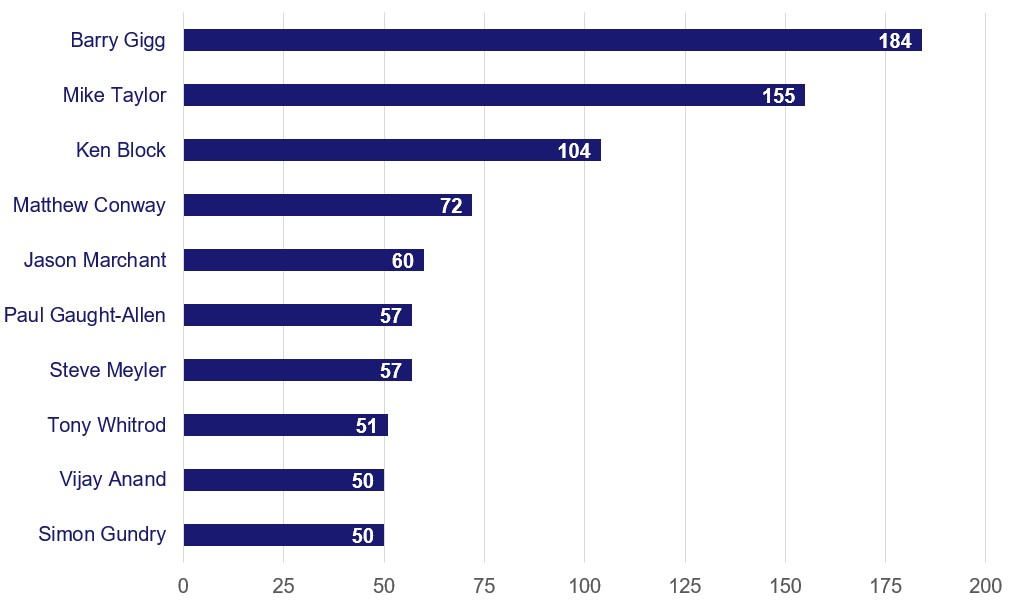
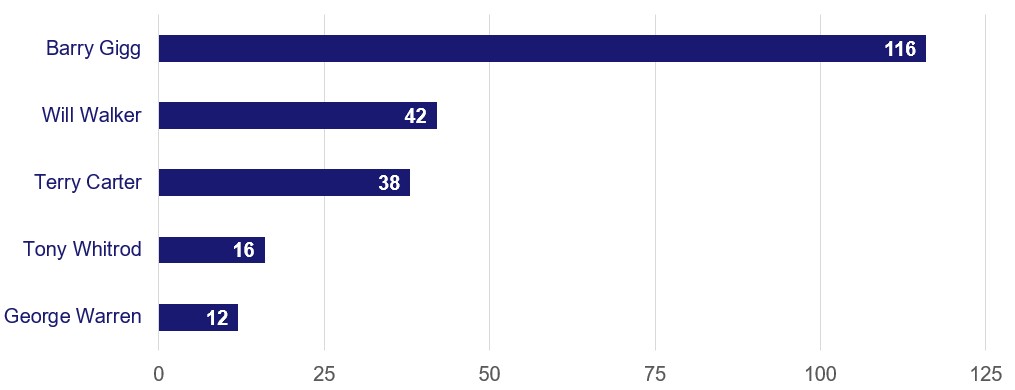
Fielding is again dominated by Barry Gigg whose 308 dismissals (189 catches, 119 stumpings) dwarfs those behind -Mike Taylor (155) and Ken Block (104) are the only ones to reach a century of fielding dismissals. |
|
|
|
|
|
| |
|
|
|
|
 |
|
|
|
|
|
|
|
|
|
|
 |
|
|
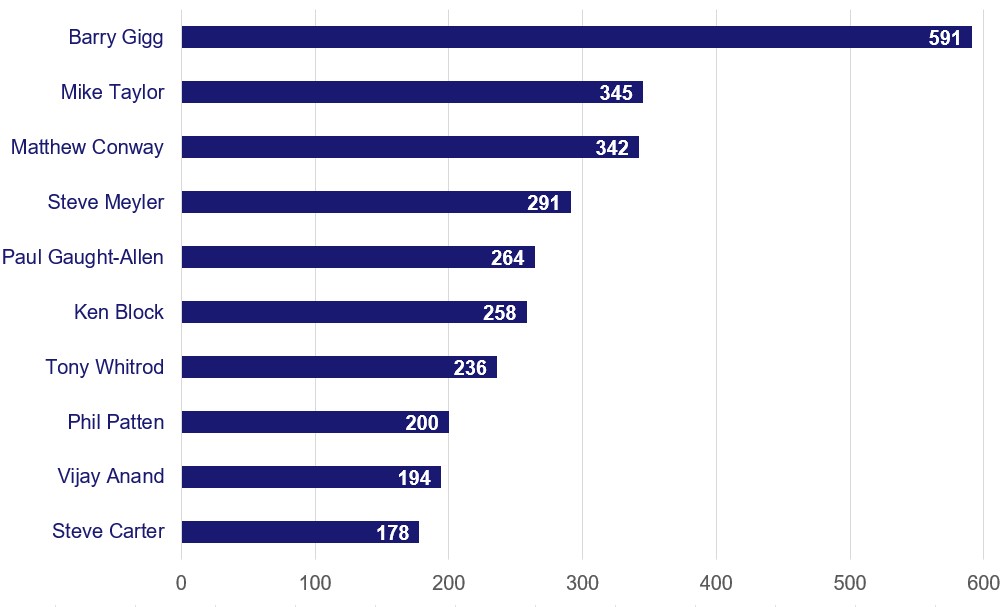
The chart below shows the ten players who have made the most appearances for Superstars. |
|
|
|
 |
|
|
|
|
|
|
|
|
|
|
|
|
|
|
|
 |
|
|
Most runs scored in a year |
|
Most wickets taken in a year |
|
|
1st |
Barry Gigg - 690 (1998) |
|
1st |
Alok Singh - 38 (2015) |
|
|
2nd |
Paul Gaught(-Allen) - 584 (2007) |
|
2nd= |
Alok Singh - 37 (2014) |
|
|
3rd |
Barry Gigg - 554 (2005) |
|
2nd= |
Ken Block - 37 (1998) |
|
|
|
Most catches taken in a year |
|
Most stumpings in a year |
|
|
1st= |
Mike Taylor - 15 (1998) |
|
1st |
Terry Carter - 11 (2000) |
|
|
1st= |
Ken Block - 15 (1995) |
|
2nd= |
Barry Gigg - 10 (2011) |
|
|
3rd |
Simon Gundry - 14 (2003) |
|
2nd= |
Barry Gigg - 10 (2019) |
|
|
|
Best Annual qualifying BATTING Averages |
|
Best Annual qualifying BOWLING Averages |
|
|
1st |
Simon Gundry - 115.50 (2001) |
|
1st |
Pete Frost - 4.11 (1989) |
|
|
2nd |
Will Walker - 109.50 (2011) |
|
2nd |
Simon Gundry - 4.75 (2014) |
|
|
3rd |
Craig Perera - 102.00 (2002) |
|
3rd |
Ken Block - 7.40 (1989) |
|
|
|
|
|
|
|
|
|
|
|
 |
|
|
|
|
|
|
|
|
|
|
|
|
|
|
 |
|
|
Qualification for averages: 20 innings. |
|
|
|
 |
 |
 |
 |
 |
 |
 |
 |
 |
 |
|
|
1 |
Will Walker |
114 |
113 |
53 |
3,196 |
53.27 |
19 |
3 |
100no |
|
|
2 |
Simon Gundry |
157 |
121 |
72 |
2,301 |
46.96 |
8 |
- |
71no |
|
|
3 |
Neil Priest |
36 |
34 |
9 |
1,024 |
40.96 |
7 |
- |
79no |
|
|
4 |
Craig Perera |
58 |
52 |
19 |
1,332 |
40.36 |
10 |
- |
74 |
|
|
5 |
Phil McBarron |
58 |
53 |
19 |
1,277 |
37.56 |
11 |
- |
76no |
|
|
6 |
Vijay Anand |
201 |
194 |
82 |
3,948 |
35.25 |
12 |
- |
83 |
|
|
7 |
Sandeep Kumar Chintala |
62 |
50 |
23 |
849 |
31.44 |
1 |
- |
76 |
|
|
8 |
Terry Carter |
106 |
81 |
36 |
1,331 |
29.58 |
3 |
- |
64no |
|
|
9 |
Barry Gigg |
605 |
551 |
162 |
10,249 |
26.35 |
40 |
2 |
102no |
|
|
10 |
Sandeep Goel |
26 |
25 |
8 |
445 |
26.18 |
- |
- |
50no |
|
|
|
Other selected players. |
|
|
17 |
Steve Meyler |
300 |
276 |
77 |
4,507 |
22.65 |
15 |
- |
82 |
|
|
18 |
Matthew Conway |
362 |
354 |
66 |
6,335 |
22.00 |
25 |
- |
95 |
|
|
21 |
Mike Taylor |
348 |
227 |
119 |
2,311 |
21.40 |
3 |
- |
58no |
|
|
22 |
Paul Gaught-Allen |
273 |
275 |
46 |
4,822 |
21.06 |
17 |
1 |
115no |
|
|
23 |
Tony Whitrod |
236 |
198 |
52 |
3,035 |
20.79 |
7 |
1 |
108no |
|
|
26 |
Chris Mountain |
154 |
133 |
40 |
1,724 |
18.54 |
3 |
- |
67no |
|
|
29 |
Ken Block |
258 |
128 |
46 |
1,395 |
17.01 |
1 |
- |
58 |
|
|
30 |
Richard Abigail |
95 |
85 |
11 |
1,228 |
16.59 |
7 |
- |
71no |
|
|
|
Notes: |
|
Batting Average = Total Runs scored/Times dismissed |
|
|
Complete batting averages,
including non-qualifiers available here, in the BAT_CAREER sheet. |
|
|
|
|
|
|
|
|
|
|
 |
|
|
The chart below shows the ten players who have scored the most runs for Superstars. |
|
|
|
 |
|
|
|
|
|
|
|
|
|
|
|
|
|
|
|
|
|
|
 |
|
|
|
|
|
|
|
|
|
|
|
|
|
|
|
|
|
|
Qualification for averages: 50 overs |
|
|
|
|
|
 |
|
 |
 |
|
 |
 |
 |
 |
|
|
1 |
Simon Gundry |
687.5 |
115 |
2,188 |
225 |
9.72 |
3.18 |
18.34 |
5 |
5-4 |
|
|
2 |
Pete Frost |
164.5 |
15 |
606 |
54 |
11.22 |
3.68 |
18.31 |
- |
- |
|
|
3 |
Alok Singh |
611 |
73 |
2,228 |
186 |
11.98 |
3.65 |
19.71 |
3 |
6-15 |
|
|
4 |
Raj Vadgama |
98.1 |
12 |
470 |
38 |
12.36 |
4.79 |
15.50 |
1 |
- |
|
|
5 |
Rick Smith |
174.4 |
8 |
925 |
68 |
13.60 |
5.30 |
15.41 |
- |
- |
|
|
6 |
John Bishop |
121.2 |
9 |
611 |
44 |
13.89 |
5.04 |
16.55 |
- |
- |
|
|
7 |
Neil Benn |
314.1 |
43 |
1,356 |
97 |
13.98 |
4.32 |
19.43 |
4 |
6-40 |
|
|
8 |
Steve Meyler |
191.3 |
5 |
1,043 |
72 |
14.49 |
5.45 |
15.96 |
- |
- |
|
|
9 |
Ken Block |
1213.1 |
114 |
4,735 |
321 |
14.75 |
3.90 |
22.68 |
3 |
- |
|
|
10 |
Mark Coram |
54 |
1 |
438 |
29 |
15.10 |
8.11 |
11.17 |
2 |
5-7 |
|
|
|
Other selected players. |
|
|
11 |
Phil Patten |
895.3 |
105 |
3,477 |
223 |
15.59 |
3.88 |
24.09 |
4 |
5-7 |
|
|
14 |
Vijay Anand |
583.2 |
67 |
2,548 |
159 |
16.25 |
4.43 |
22.01 |
- |
- |
|
|
16 |
Dan Forman |
283 |
11 |
1,603 |
96 |
16.70 |
5.66 |
17.69 |
2 |
5-20 |
|
|
20 |
Jason Marchant |
633.2 |
29 |
3,340 |
188 |
17.77 |
5.27 |
20.21 |
- |
- |
|
|
21 |
Tom Wilson |
594.4 |
42 |
2,542 |
139 |
18.29 |
4.27 |
25.67 |
2 |
- |
|
|
28 |
Chris Mountain |
499.2 |
20 |
2,455 |
128 |
19.18 |
4.92 |
23.40 |
1 |
5-7 |
|
|
30 |
Matthew Conway |
570.4 |
32 |
2,945 |
141 |
20.89 |
5.16 |
24.28 |
- |
- |
|
|
31 |
Mike Kamellard |
408.2 |
22 |
2,078 |
99 |
20.99 |
5.09 |
24.75 |
- |
- |
|
|
32 |
Merv Aranha |
198.1 |
7 |
999 |
47 |
21.26 |
5.04 |
25.30 |
- |
- |
|
|
37 |
Michael Duggan |
596 |
8 |
4,465 |
192 |
23.26 |
7.49 |
18.63 |
- |
- |
|
|
38 |
Mike Taylor |
1491.2 |
98 |
7,078 |
302 |
23.44 |
4.75 |
29.63 |
2 |
- |
|
|
43 |
Konrad Chodzko-Zajko |
569.2 |
54 |
2,540 |
99 |
25.66 |
4.46 |
34.51 |
- |
- |
|
|
46 |
Gary Plahe |
582.3 |
22 |
3,373 |
123 |
27.42 |
5.79 |
28.41 |
- |
- |
|
|
|
Notes: |
|
Bowling Average = Total Runs conceded/Total wickets |
|
Economy Rate = Total Runs conceded/Total overs (remembering there are 6 balls in an over, not 10) |
|
Strike Rate = Total balls balled/Total wickets |
|
|
Complete bowling averages,
including non-qualifiers available here, in the BOWL_CAREER sheet. |
|
|
|
|
|
|
|
|
|
|
 |
|
|
The chart below shows the ten players who have taken the most wickets for Superstars. |
|
|
|
 |
|
|
|
|
|
|
|
|
|
|
|
|
|
|
 |
|
|
|
|
|
|
|
|
|
|
 |
|
|
|
|
 |
 |
 |
 |
|
|
|
1 |
Barry Gigg |
605 |
189 |
119 |
308 |
|
|
2 |
Mike Taylor |
348 |
155 |
- |
155 |
|
|
3 |
Ken Block |
258 |
104 |
- |
104 |
|
|
4 |
Terry Carter |
106 |
47 |
38 |
85 |
|
|
5 |
Will Walker |
114 |
40 |
42 |
82 |
|
|
6 |
Matthew Conway |
114 |
75 |
3 |
78 |
|
|
7 |
Tony Whitrod |
236 |
51 |
16 |
67 |
|
|
8 |
Paul Gaught-Allen |
273 |
63 |
1 |
64 |
|
|
9 |
Jason Marchant |
144 |
60 |
- |
60 |
|
|
10 |
Steve Meyler |
300 |
57 |
- |
57 |
|
|
|
Other selected players. |
|
|
11= |
Vijay Anand |
201 |
51 |
1 |
52 |
|
|
13 |
Adam Spencer(-Bickle) |
156 |
44 |
- |
44 |
|
|
14 |
Chris Mountain |
154 |
32 |
6 |
38 |
|
|
20 |
Michael Duggan |
188 |
27 |
- |
27 |
|
|
22= |
Phil Patten |
200 |
25 |
- |
25 |
|
|
25 |
Konrad Chodzko-Zajko |
138 |
23 |
- |
23 |
|
|
26 |
James Hewlett |
61 |
21 |
- |
21 |
|
|
30= |
Dan Forman |
77 |
16 |
- |
16 |
|
|
30= |
Pete Frost |
42 |
16 |
- |
16 |
|
|
34= |
Steve Carter |
178 |
9 |
6 |
15 |
|
|
| Complete fielding stats available here, in the FIELD_CAREER sheet. |
|
|
|
|
|
|
|
|
|
 |
|
|
The chart below shows the ten players who have held the most catches for Superstars. |
|
|
|
 |
|
|
|
|
|
|
|
|
|
|
 |
|
|
The chart below shows the five players who have nailed the most stumpings for Superstars. |
|
|
|
 |
|
|
|
|
|
|
|
|
|
|
|
|
|
|
 |
|
|
The complete Excel workbook for the 2025 career statistics is downloadable. |
|
|
|
 |
|
|
|
|
|


