|
|
|
|
|
|
|
The 2019 Superstars season was successful in many ways (friendships made and
strengthened, beers drunk and fun had) but it was not the most successful on the pitch. In fact the win ratio of 37.5% was lowest since
1987 (where Superstars only played three games) and followed two years of win ratios below 40%. |
|
|
|
|
|
|
|
The accepted wisdom, especially with the ever increasing Superstars bowling
faction, is that this has been caused by poor batting. Recently the club has lost or seen far reduced appearences from some of our greatest
batsmen, including Walker (6th greatest run accumulator in the club's history), Meyler (4th), Spencer-Bickle (8th), Gaught (3rd) - at
the same time the club's greatest run scorer (Barry Gigg) insists on protecting his batting average by batting very low in the batting order. |
|
|
|
|
|
|
|
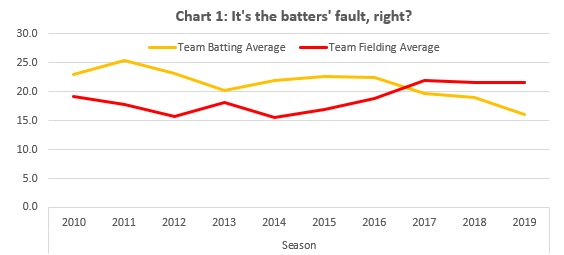
But is this accepted wisdow correct? Well in 2019 it probably is with the club's
collective batting average decreasing to an all time low* (16.01) while the club's fielding average remained broadly the same as in 2018. Before
that the blame for our previous two years of haplessness appears to be equally shared with shoddiness all round. (See Chart 1 below). |
|
|
|
|
|
|
|
 |
|
|
|
|
|
|
|
So what caused this low figure? Well Superstars didn't manage to reach 200 runs
all season (in one innings, we weren't THAT bad) but this isn't as rare as your writer thought when he started writing this sentence - it's
happened in three other seasons since 2010 - so perhaps it's not that but the number of low scores. Yes that must be right. |
|
|
|
|
|
|
|
And indeed the Superstars collapse has become a stable of the English summer
- like strawberries and cream, Henley Regetta and persistent drizzle - and there were some great examples in 2019. When your writer looked
through to produce a "short list" of examples it took three or four iterations to whittle the list down to a short(ish) list of the
six worst occasions. The short list was decided as- |
|
|
|
|
|
|
|
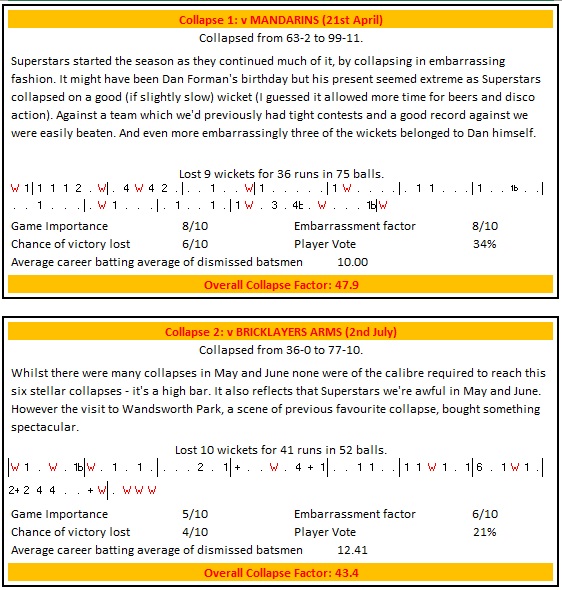
v Mandarins 9 wickets lost for 36. 63-2 to 99-11. |
|
|
|
|
|
|
|
v Bricklayers 10 wickets lost for 41. 36-0 to 77-10. |
|
|
|
|
|
|
|
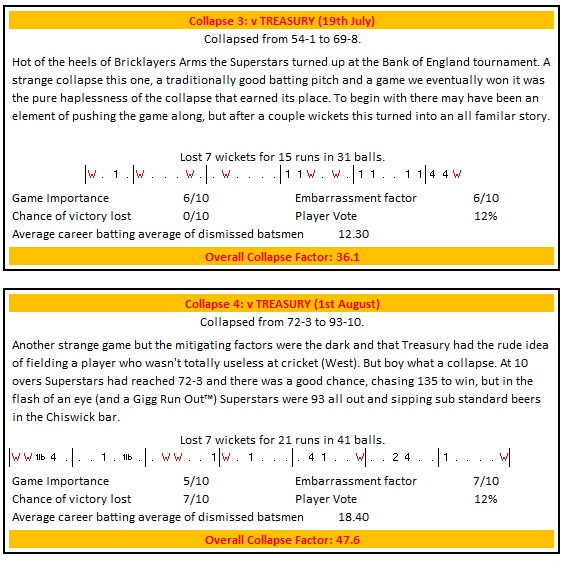
v Treasury 7 wickets lost for 15. 54-1 to 69-8. |
|
|
|
|
|
|
|
v Treasury 7 wickets lost for 21. 72-3 to 93-10. |
|
|
|
|
|
|
|
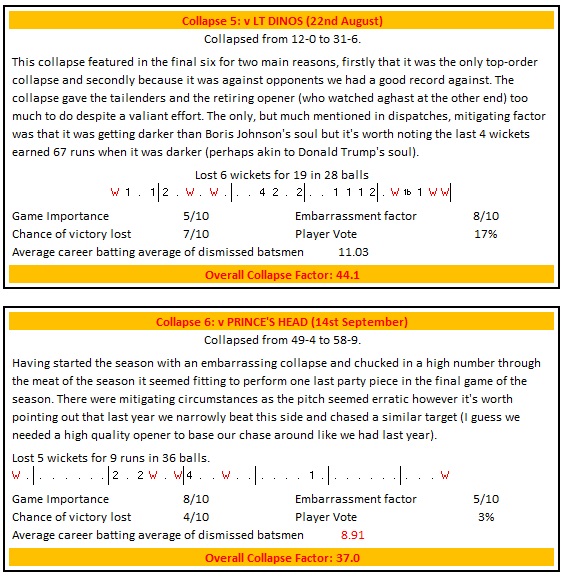
v LT Dinos 6 wickets lost for 19. 12-0 to 31-6. |
|
|
|
|
|
|
|
v Princes Head 5 wickets for 9. 49-4 to 58-9. |
|
|
|
|
|
|
|
* Since recorded were collected and published on this metric. |
|
|
|
|
|
|
|
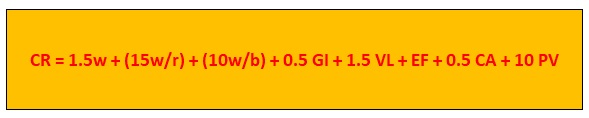
But which was the collapse of the year? There's only one way to find out
(no, not that way Harry Hill�) a deep statistical analysis that actually is your writer making up an equation that comes out with a
sensible but definitely debatable conclusion that doesn't really solve anything. |
|
|
|
|
|
|
|
After a huge amount of statistical analysis and regressions**
it was decided that the the formula to judge the best (or should that be worst?) collapse should be- |
|
|
|
|
|
|
|
 |
|
|
|
|
|
|
|
CR = Collapse Rating |
|
|
|
|
|
|
|
w = Wickets lost |
|
|
|
|
|
|
|
r = runs scored |
|
|
|
|
|
|
|
b = balls faced |
|
|
|
|
|
|
|
GI = Game Importance |
|
|
|
|
|
|
|
VL = Chance of victory lost |
|
|
|
|
|
|
|
EF = Embarrassment factor |
|
|
|
|
|
|
|
CA = Career Average of the Superstars batsmen dismissed |
|
|
|
|
|
|
|
PV = Player Vote (%) |
|
|
|
|
|
|
|
** This is a lie, but given we're in the middle of
an election that's totally fitting. |
|
|
|
|
|
|
|
 |
|
|
|
|
|
|
|
 |
|
|
|
|
|
|
|
 |
|
|
|
|
|
|
|
So those of you who can do simple mathematics (which is
most of us, as we're all used to having to count up how many times Barry and Bish have run us out in a season) will have
worked out that the final scores on the doors but for those a little slow for whatever the reason here are the final results- |
|
|
|
|
|
|
|
Collapse 1: v MANDARINS (21st April): 47.9 Collapse Rating |
|
|
|
|
|
|
|
Collapse 4: v TREASURY (1st August): 47.6 Collapse Rating |
|
|
|
|
|
|
|
Collapse 5: v LT DINOS (22nd August): 44.1 Collapse Rating |
|
|
|
|
|
|
|
Collapse 2: v BRICKLAYERS ARMS (2nd July): 43.4 Collapse Rating |
|
|
|
|
|
|
|
Collapse 6: v PRINCE'S HEAD (14st September): 37.0 Collapse Rating |
|
|
|
|
|
|
|
Collapse 3: v TREASURY (19th July): 36.1 Collapse Rating |
|
|
|
|
|
|
|
I think we can all agree (apart from those who are wrong) that the Mandarins
collapse was a fitting winner. The names of those involved have been redacted to ensure the rather jovial nature of this analysis
remains but it's all on the website so it's all name and shame there. |
|
|
|
|
|